matlab的操作步骤:
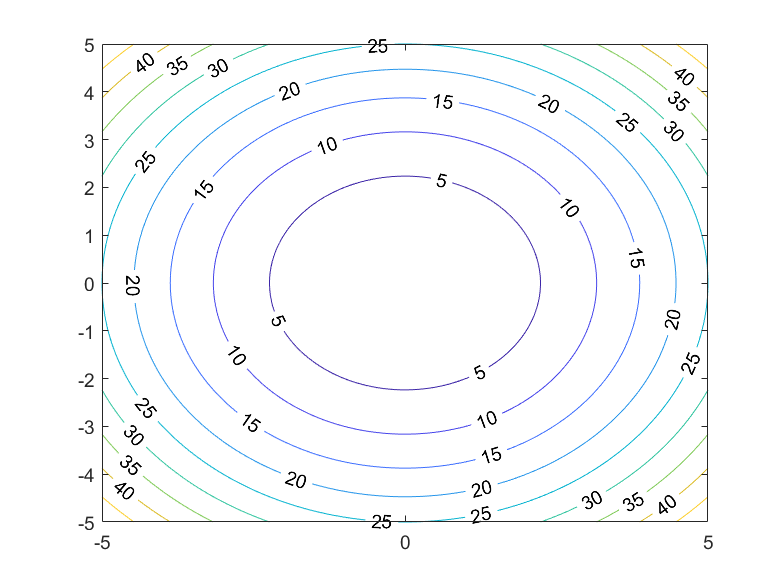
- 产生独立变量,为带有两个变量 x 和 y 的集合,meshgrid是一个可以建立独立变量的函数,产生矩阵元素,元素x和y按照指定的范围和增量来产生。
- 输入要使用的函数
- 调用contour(x,y,w)命令,contour函数是画一个多维函数的等高线
1
2
3
4
| [x,y] = meshgrid(-5:0.05:5,-5:0.05:5)
w = x.^2+y.^2
contour(x,y,w, 'showText', 'on')
|

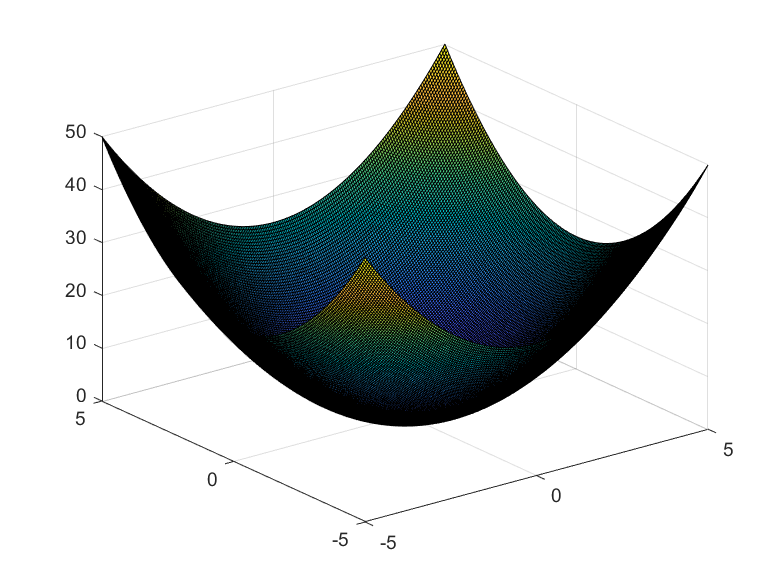
surf函数用于画三维的等高线

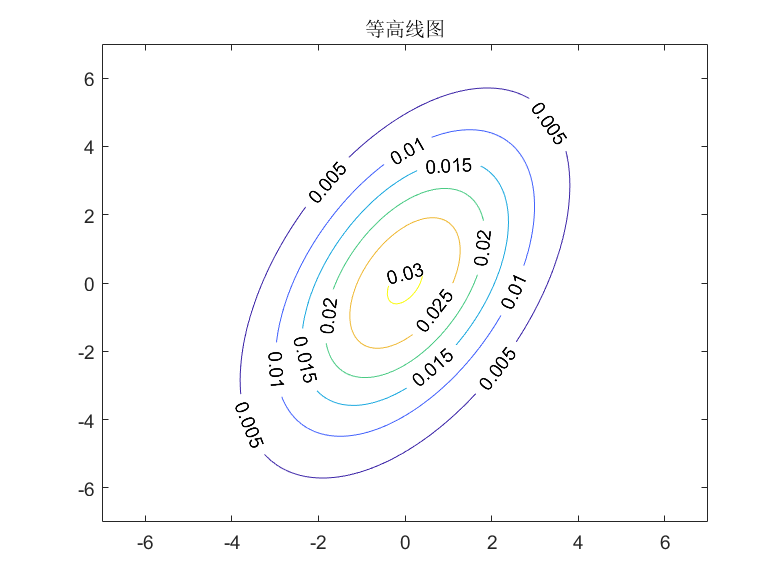
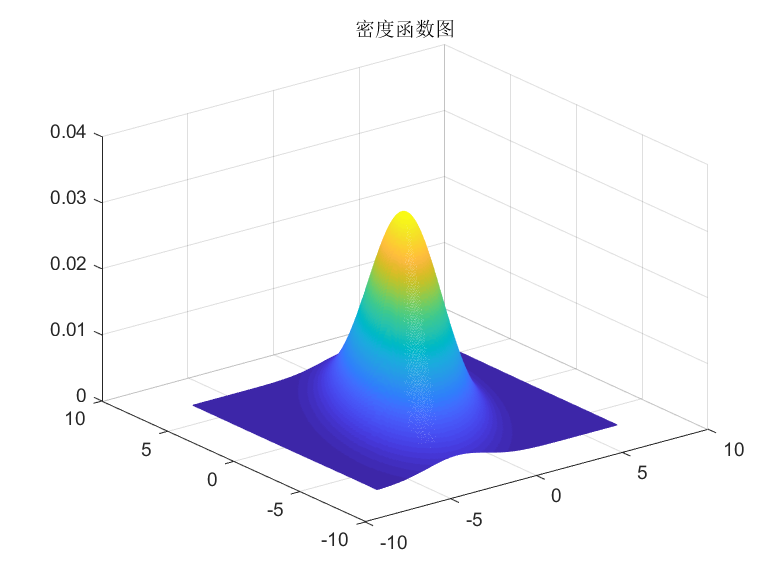
高维高斯分布的概率密度函数和等高线图
1
2
3
4
5
6
7
8
9
10
11
12
13
14
15
16
17
18
19
20
21
22
| u=[0;0];%均值
v=[4,3;3,9];%协方差阵
x=-7:0.05:7;
y=-7:0.05:7;
[X,Y]=meshgrid(x,y);
s2x=v(1,1) %x的方差
s2y=v(2,2)
sx=sqrt(s2x) %标准差多个
sy=sqrt(s2y)
Cov=v(1,2)
r=Cov/(sx*sy)
a=1/(2*pi*sx*sy*sqrt(1-r^2));
b1=-1/(2*(1-r^2));
b2=((X-u(1))./sx).^2;
b3=((Y-u(2))./sy).^2;
b4=2*r.*(X-u(1)).*(Y-u(2))./(sx*sy)
Z=a*exp(b1*(b2+b3-b4)); %也就是f(x1,x2)的表达式
mesh(X,Y,Z),title('密度函数图')
figure
contour(X,Y,Z,'showText','on'),title('等高线图')
|


参考: 使用surface 和 contour 画图


