实现二进制栅格地图
The object keeps track of three reference frames: world, local, and, grid. 世界坐标系的原点由GridLocationInWorld决定, which defines the bottom-left corner of the map relative to the world frame. LocalOriginInWorld property specifies the location of the origin of the local frame relative to the world frame. The first grid location with index (1,1) begins in the top-left corner of the grid.
map = binaryOccupancyMap creates a 2-D binary occupancy grid with a width and height of 10m. The default grid resolution is one cell per meter.
1 | image = imread('F:\map.pgm'); |
读取建好的pgm地图,如果直接imshow,结果就是pgm文件的本来样子
加下面几句后,结果是这样的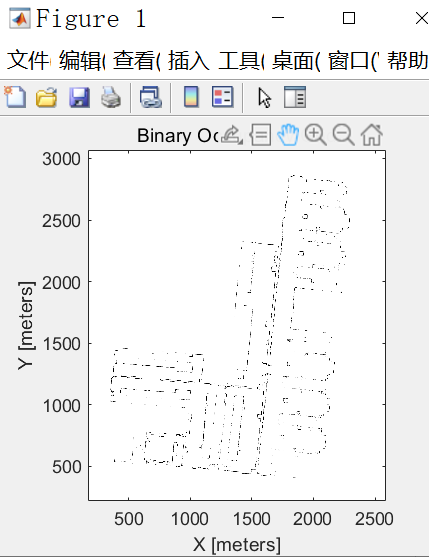
实现栅格地图
occupancyMap对象support local coordinates, world coordinates, and grid indices. The first grid location with index (1,1) begins in the top-left corner of the grid.
Use the occupancyMap class to create 2-D maps of an environment with probability values representing different obstacles in your world. You can specify exact probability values of cells or include observations from sensors such as laser scanners.
Probability values are stored using a binary Bayes filter to estimate the occupancy of each grid cell. A log-odds representation is used, with values stored as int16 to reduce the map storage size and allow for real-time applications.
1 | image = imread('F:\map.pgm'); |
pgm文件中的值是0~255的uint8类型,将其归一化:先转为double类型,再除以255. 图片中的障碍物对应值为0,应该用1减去它,这样1就代表障碍物了. 否则图片显示出来是一团黑.
使用occupancyMap函数创建栅格地图,分辨率为1米20个cell,所支持的分辨率极限是±0.001
读取雷达扫描结果
1 | # 建一个空地图,宽和高依次为10m,分辨率20,也就是1米有20个cell |
linspace(x,y,n)是Matlab中的一个指令,用于产生x,y之间n点行矢量。其中x是起始值、y是中止值,n表示元素个数,如果缺省,则默认n为100。
linspace(1,10,2)为1,10. linspace(1,10,4)为1,4,7,10
laserScan对象
使用laserScan对象作为一些机器人算法的输入,例如matchScans, controllerVFH, monteCarloLocalization.1
2
3
4// ranges and angles inputs are vectors of the same length
scan = lidarScan(ranges,angles)
scan = lidarScan(cart)
scan = lidarScan(scanMsg) # 从ROS message中创建plot(scan)可以显示雷达扫描的曲线
1 | minRange = 0.1; |
根据指定的范围,移除invalid数据